Troubleshooting Tools
There are several important tools for troubleshooting traffic flow through the firewall. A best practice in troubleshooting is to separate general connectivity issues from those of security. Connectivity issues should be resolved before security processing is evaluated.
The WebUI provides several important tools. The path Monitor > Logs > Traffic log provides Session summary information. Log entries for traffic are generated as specified in Security policies. The typical configuration specifies that log entries are created when a session ends. Use the magnifying glass icon to examine this log entry for detail.
The Clear checkbox at the end of a session summary line can be used to end the session immediately, often generating the desired log entry.
The CLI show commands will assist with troubleshooting. The WebUI Traffic Capture and CLI pcap and Debug functions give greater visibility to system-level operation for troubleshooting. A complete discussion about packet captures is found on this link.
Connectivity issues often arise from unexpected traffic-forwarding decisions. Find the simplest view into forwarding decisions by displaying the Layer 3 routing and forwarding tables in the WebUI:
Policy-based forwarding (PBF) policies can override routing decisions and must be considered when troubleshooting connectivity. The routing and forwarding tables mentioned do not show the effects of existing PBF policies. PBF troubleshooting is best done on the CLI; show commands can display existing PBF policies and whether they are active. The test pbf-policy-match command will show the application of existing PBF policies on modeled traffic.

R1#configure terminal
Enter configuration commands, one per line. End with CNTL/Z.
R1(config)#interface fastethernet0/0
R1(config-if)#description ### ISP Link 1 ###
R1(config-if)#ip address 172.31.104.1 255.255.255.248
R1(config-if)#no shutdown
R1(config-if)#interface fastethernet0/1
R1(config-if)#description ### ISP Link 2 ###
R1(config-if)#ip address 172.31.106.1 255.255.255.248
R1(config-if)#no shutdown
R1(config-if)#interface loopback1
R1(config-if)#
*Mar 31 11:05:50.027: %LINEPROTO-5-UPDOWN: Line protocol on Interface Loopback1, changed state to up
R1(config-if)#ip address 172.20.101.1 255.255.255.255
R1(config-if)#description ### SERVER1 ###
R1(config-if)#interface loopback2
R1(config-if)#
*Mar 31 11:07:14.523: %LINEPROTO-5-UPDOWN: Line protocol on Interface Loopback2, changed state to up
R1(config-if)#ip address 8.8.8.8 255.255.255.255
R1(config-if)#description ### GOOGLE DNS ###


From a host PC on the TRUST-L3 zone, I can ping the external server 172.20.101.1 and Google DNS 8.8.8.8.
C:\Users\User>ipconfig
Windows IP Configuration
Wireless LAN adapter Wi-Fi:
Connection-specific DNS Suffix . :
Link-local IPv6 Address . . . . . : fe80::a026:ea0:2d87:a41%7
IPv4 Address. . . . . . . . . . . : 172.17.101.13
Subnet Mask . . . . . . . . . . . : 255.255.255.0
Default Gateway . . . . . . . . . : 172.17.101.1
C:\Users\User>ping 8.8.8.8
Pinging 8.8.8.8 with 32 bytes of data:
Reply from 8.8.8.8: bytes=32 time=9ms TTL=253
Reply from 8.8.8.8: bytes=32 time=8ms TTL=253
Reply from 8.8.8.8: bytes=32 time=8ms TTL=253
Reply from 8.8.8.8: bytes=32 time=7ms TTL=253
Ping statistics for 8.8.8.8:
Packets: Sent = 4, Received = 4, Lost = 0 (0% loss),
Approximate round trip times in milli-seconds:
Minimum = 7ms, Maximum = 9ms, Average = 8ms
C:\Users\User>tracert 8.8.8.8
Tracing route to 8.8.8.8 over a maximum of 30 hops
1 8 ms 5 ms 4 ms 172.17.101.1
2 7 ms 4 ms 3 ms 172.17.99.1
3 7 ms 4 ms 4 ms 8.8.8.8
Trace complete.
C:\Users\User>ping 172.20.101.1
Pinging 172.20.101.1 with 32 bytes of data:
Reply from 172.20.101.1: bytes=32 time=7ms TTL=253
Reply from 172.20.101.1: bytes=32 time=10ms TTL=253
Reply from 172.20.101.1: bytes=32 time=5ms TTL=253
Reply from 172.20.101.1: bytes=32 time=4ms TTL=253
Ping statistics for 172.20.101.1:
Packets: Sent = 4, Received = 4, Lost = 0 (0% loss),
Approximate round trip times in milli-seconds:
Minimum = 4ms, Maximum = 10ms, Average = 6ms
C:\Users\User>tracert 172.20.101.1
Tracing route to 172.20.101.1 over a maximum of 30 hops
1 5 ms 4 ms 4 ms 172.17.101.1
2 6 ms 4 ms 3 ms 172.17.99.1
3 8 ms 4 ms 4 ms 172.20.101.1
Trace complete.
Below are some useful show command to verify the routing table and PBF on a PAN firewall.
admin@PA-200-LAB> show pbf
> return-mac PBF return mac info
> rule PBF rule status
admin@PA-200-LAB> show pbf rule
> all Show all PBF rules
> name name
admin@PA-200-LAB> show pbf rule all
Rule ID Rule State Action Egress IF/VSYS NextHop
NextHop Status
========== ===== ========== ======== =============== ===========================
============ ==============
LAB-PBF 1 Active Forward ethernet1/1 172.31.104.1
UP
admin@PA-200-LAB> show routing
> fib show forwarding table entries
> interface show interface status
> multicast show multicast routing protocol information
> protocol show dynamic routing protocol information
> resource show resource usage
> route show route entries
> summary show summary information
admin@PA-200-LAB> show routing route
flags: A:active, ?:loose, C:connect, H:host, S:static, ~:internal, R:rip, O:ospf
, B:bgp,
Oi:ospf intra-area, Oo:ospf inter-area, O1:ospf ext-type-1, O2:ospf ext-t
ype-2
VIRTUAL ROUTER: LAB-VR (id 2)
==========
destination nexthop
metric flags age interface next-AS
0.0.0.0/0 172.31.104.1
10 A S ethernet1/1 // STATIC ROUTE VIA 172.31.104.1 (ISP1) IS THE CURRENTLY ACTIVE 'A'
0.0.0.0/0 172.31.106.1
20 S ethernet1/4
172.17.11.0/24 0.0.0.0
10 Oi 9957 ethernet1/3.11
172.17.11.0/24 172.17.11.1
0 A C ethernet1/3.11
172.17.11.1/32 0.0.0.0
0 A H
172.17.99.0/29 0.0.0.0
10 Oi 9957 ethernet1/2
172.17.99.0/29 172.17.99.1
0 A C ethernet1/2
172.17.99.1/32 0.0.0.0
0 A H
172.17.101.0/24 172.17.99.2
11 A Oo 3285 ethernet1/2
172.31.104.0/29 172.31.104.2
0 A C ethernet1/1
172.31.104.2/32 0.0.0.0
0 A H
172.31.106.0/29 172.31.106.6
0 A C ethernet1/4
172.31.106.6/32 0.0.0.0
0 A H
192.168.1.1/32 0.0.0.0
0 A H
total routes shown: 14


The PBF status went down and the static (floating) route via ISP2 link became active.
admin@PA-200-LAB> show pbf rule all
Rule ID Rule State Action Egress IF/VSYS NextHop
NextHop Status
========== ===== ========== ======== =============== ===========================
============ ==============
LAB-PBF 1 Disabled Forward ethernet1/1 172.31.104.1
DOWN
admin@PA-200-LAB> show routing route
flags: A:active, ?:loose, C:connect, H:host, S:static, ~:internal, R:rip, O:ospf
, B:bgp,
Oi:ospf intra-area, Oo:ospf inter-area, O1:ospf ext-type-1, O2:ospf ext-t
ype-2
VIRTUAL ROUTER: LAB-VR (id 2)
==========
destination nexthop
metric flags age interface next-AS
0.0.0.0/0 172.31.106.1
20 A S ethernet1/4 // THE STATIC ROUTE VIA ISP2 BECAME ACTIVE
172.17.11.0/24 0.0.0.0
10 Oi 10318 ethernet1/3.11
172.17.11.0/24 172.17.11.1
0 A C ethernet1/3.11
172.17.11.1/32 0.0.0.0
0 A H
172.17.99.0/29 0.0.0.0
10 Oi 10318 ethernet1/2
172.17.99.0/29 172.17.99.1
0 A C ethernet1/2
172.17.99.1/32 0.0.0.0
0 A H
172.17.101.0/24 172.17.99.2
11 A Oo 3646 ethernet1/2
172.31.106.0/29 172.31.106.6
0 A C ethernet1/4
172.31.106.6/32 0.0.0.0
0 A H
192.168.1.1/32 0.0.0.0
0 A H
total routes shown: 11


There are several important tools for troubleshooting traffic flow through the firewall. A best practice in troubleshooting is to separate general connectivity issues from those of security. Connectivity issues should be resolved before security processing is evaluated.
The WebUI provides several important tools. The path Monitor > Logs > Traffic log provides Session summary information. Log entries for traffic are generated as specified in Security policies. The typical configuration specifies that log entries are created when a session ends. Use the magnifying glass icon to examine this log entry for detail.
The Clear checkbox at the end of a session summary line can be used to end the session immediately, often generating the desired log entry.
The CLI show commands will assist with troubleshooting. The WebUI Traffic Capture and CLI pcap and Debug functions give greater visibility to system-level operation for troubleshooting. A complete discussion about packet captures is found on this link.
Connectivity issues often arise from unexpected traffic-forwarding decisions. Find the simplest view into forwarding decisions by displaying the Layer 3 routing and forwarding tables in the WebUI:
Policy-based forwarding (PBF) policies can override routing decisions and must be considered when troubleshooting connectivity. The routing and forwarding tables mentioned do not show the effects of existing PBF policies. PBF troubleshooting is best done on the CLI; show commands can display existing PBF policies and whether they are active. The test pbf-policy-match command will show the application of existing PBF policies on modeled traffic.

To configure dual ISP links on a PAN firewall, you configure
two Layer 3 WAN interfaces and create a Policy-Based Forwarding (PBF) rule. I've configured R1 to use both F0/0 and F0/1 for ISP1 and ISP2 WAN links and created loopback interfaces to simulate server host IP addresses over the Internet.
Enter configuration commands, one per line. End with CNTL/Z.
R1(config)#interface fastethernet0/0
R1(config-if)#description ### ISP Link 1 ###
R1(config-if)#ip address 172.31.104.1 255.255.255.248
R1(config-if)#no shutdown
R1(config-if)#interface fastethernet0/1
R1(config-if)#description ### ISP Link 2 ###
R1(config-if)#ip address 172.31.106.1 255.255.255.248
R1(config-if)#no shutdown
R1(config-if)#interface loopback1
R1(config-if)#
*Mar 31 11:05:50.027: %LINEPROTO-5-UPDOWN: Line protocol on Interface Loopback1, changed state to up
R1(config-if)#ip address 172.20.101.1 255.255.255.255
R1(config-if)#description ### SERVER1 ###
R1(config-if)#interface loopback2
R1(config-if)#
*Mar 31 11:07:14.523: %LINEPROTO-5-UPDOWN: Line protocol on Interface Loopback2, changed state to up
R1(config-if)#ip address 8.8.8.8 255.255.255.255
R1(config-if)#description ### GOOGLE DNS ###
On the PAN firewall, I've re-configured ethernet1/1 interface with a static IP address
under Networks > Interfaces >
ethernet1/1.
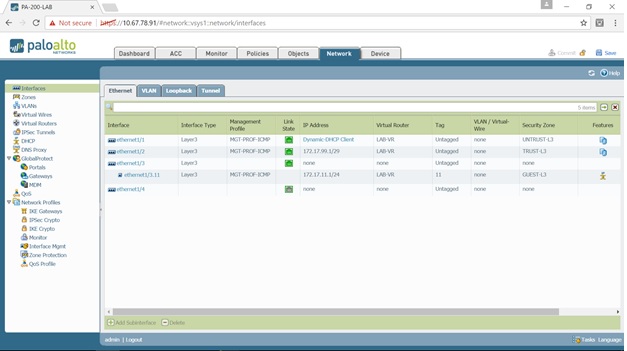
Go to IPv4 tab >
choose Static > Add > type the IP address 172.31.104.2/29 > click OK.


Click ethernet1/4 to configure the Layer 3 interface: choose Layer 3 under Interface Type >
choose LAB-VR under Virtual Router > choose UNTRUST-L3 under Security Zone.

Go to IPv4 tab >
choose Static > Add > type 172.31.106.6/29.

Go to Advanced tab >
choose MGT-PROF-ICMP under Management Profile to allow pings on ethernet1/4
> click OK.


Configure a new Monitor Profile under Network > Network Profiles > Monitor > Add.

Type a Name for the
Monitor Profile (LAB-MONITOR-PROF) > choose Fail Over for the Action >
leave the timers in default > click OK.

Configure Policy-Based Forwarding (PBF) under Policies >
Policy Based Forwarding > Add. The PAN firewall will check PBF rule first
before consulting its routing table (Virtual Router).

Type a Name of the PBF
under General tab.

Under Source tab > Zone
> Add > choose TRUST-L3.

Leave the fields in default under
Destination/Application/Service which is Any Destination Address and Any
Application or Service going to the UNTRUST-L3 zone/Internet.

Under Forwarding tab
> Action > leave the Action of Forward.

Choose ethernet1/1
under Egress Interface. This will be the Primary exit interface for the
TRUST-L3 users.

Type 172.31.104.1
under Next Hop which the ISP1 Link next hop IP address > tick Monitor >
choose LAB-MONITOR-PROF under Profile.

Tick Disable this rule
if nexthop/monitor ip is unreachable > type 172.20.101.1 under IP Address
which is the Server over the Internet > click OK.


Configure static routes under Network > Virtual Router > click LAB-VR.

Under Static Routes > tick the Name of the static route
(R1-REMOTE-LAN) to remove the static route from the previous Site-to-Site IPSec
VPN lab > delete.

Create a static default route to ISP1 by clicking Add > Type a Name for the static route
(DEFAULT-ROUTE-ISP1) > type 0.0.0.0/0 under Destination > choose
ethernet1/1 under Interface > leave the default of IP Address under Next Hop
> type 172.31.104.1 which is the IP Address of ISP1 Link > click OK.


Create a floating static route to ISP2 Link by clicking Add > type a Name for the static route
(DEFAULT-ROUTE-ISP2) > type 0.0.0.0/0 under Destination > choose
ethernet1/4 under Interface > leave the default of IP Address under Next Hop
> type 172.31.106.1 which is the IP Address of ISP2 Link > type 240 which
is the highest Admin Distance (floating static route) > type 20 under Metric
> click OK.


Make sure to create a Security and NAT rules for the second
ISP2 Link under Policies > Security.
Based on Security rule 2, the ISP2 Link is also configured as UNTRUST-L3
zone and it will use the same rule. So there’s no need to create a separate
Security rule for ISP2 Link.

The Destination Interface under NAT rules all use
ethernet1/1. Clone NAT Rule 1 (SOURCE-NAT-TRUST) and change the Destination
Interface to use ethernet1/4.


Under General tab >
type a Name for the cloned NAT rule (SOURCE-NAT-ISP2) > optionally type a
Description.

Under Original Packet
tab > choose ethernet1/4 under Destination Zone > Destination Interface
> leave the other fields in default.

Under Translated
Packet tab > choose ethernet1/4 under Interface.

Type 172.31.106.6/29
under IP Address > click OK > Commit.


From a host PC on the TRUST-L3 zone, I can ping the external server 172.20.101.1 and Google DNS 8.8.8.8.
C:\Users\User>ipconfig
Windows IP Configuration
Wireless LAN adapter Wi-Fi:
Connection-specific DNS Suffix . :
Link-local IPv6 Address . . . . . : fe80::a026:ea0:2d87:a41%7
IPv4 Address. . . . . . . . . . . : 172.17.101.13
Subnet Mask . . . . . . . . . . . : 255.255.255.0
Default Gateway . . . . . . . . . : 172.17.101.1
C:\Users\User>ping 8.8.8.8
Pinging 8.8.8.8 with 32 bytes of data:
Reply from 8.8.8.8: bytes=32 time=9ms TTL=253
Reply from 8.8.8.8: bytes=32 time=8ms TTL=253
Reply from 8.8.8.8: bytes=32 time=8ms TTL=253
Reply from 8.8.8.8: bytes=32 time=7ms TTL=253
Ping statistics for 8.8.8.8:
Packets: Sent = 4, Received = 4, Lost = 0 (0% loss),
Approximate round trip times in milli-seconds:
Minimum = 7ms, Maximum = 9ms, Average = 8ms
C:\Users\User>tracert 8.8.8.8
Tracing route to 8.8.8.8 over a maximum of 30 hops
1 8 ms 5 ms 4 ms 172.17.101.1
2 7 ms 4 ms 3 ms 172.17.99.1
3 7 ms 4 ms 4 ms 8.8.8.8
Trace complete.
C:\Users\User>ping 172.20.101.1
Pinging 172.20.101.1 with 32 bytes of data:
Reply from 172.20.101.1: bytes=32 time=7ms TTL=253
Reply from 172.20.101.1: bytes=32 time=10ms TTL=253
Reply from 172.20.101.1: bytes=32 time=5ms TTL=253
Reply from 172.20.101.1: bytes=32 time=4ms TTL=253
Ping statistics for 172.20.101.1:
Packets: Sent = 4, Received = 4, Lost = 0 (0% loss),
Approximate round trip times in milli-seconds:
Minimum = 4ms, Maximum = 10ms, Average = 6ms
C:\Users\User>tracert 172.20.101.1
Tracing route to 172.20.101.1 over a maximum of 30 hops
1 5 ms 4 ms 4 ms 172.17.101.1
2 6 ms 4 ms 3 ms 172.17.99.1
3 8 ms 4 ms 4 ms 172.20.101.1
Trace complete.
Below are some useful show command to verify the routing table and PBF on a PAN firewall.
admin@PA-200-LAB> show pbf
> return-mac PBF return mac info
> rule PBF rule status
admin@PA-200-LAB> show pbf rule
> all Show all PBF rules
> name name
admin@PA-200-LAB> show pbf rule all
Rule ID Rule State Action Egress IF/VSYS NextHop
NextHop Status
========== ===== ========== ======== =============== ===========================
============ ==============
LAB-PBF 1 Active Forward ethernet1/1 172.31.104.1
UP
admin@PA-200-LAB> show routing
> fib show forwarding table entries
> interface show interface status
> multicast show multicast routing protocol information
> protocol show dynamic routing protocol information
> resource show resource usage
> route show route entries
> summary show summary information
admin@PA-200-LAB> show routing route
flags: A:active, ?:loose, C:connect, H:host, S:static, ~:internal, R:rip, O:ospf
, B:bgp,
Oi:ospf intra-area, Oo:ospf inter-area, O1:ospf ext-type-1, O2:ospf ext-t
ype-2
VIRTUAL ROUTER: LAB-VR (id 2)
==========
destination nexthop
metric flags age interface next-AS
0.0.0.0/0 172.31.104.1
10 A S ethernet1/1 // STATIC ROUTE VIA 172.31.104.1 (ISP1) IS THE CURRENTLY ACTIVE 'A'
0.0.0.0/0 172.31.106.1
20 S ethernet1/4
172.17.11.0/24 0.0.0.0
10 Oi 9957 ethernet1/3.11
172.17.11.0/24 172.17.11.1
0 A C ethernet1/3.11
172.17.11.1/32 0.0.0.0
0 A H
172.17.99.0/29 0.0.0.0
10 Oi 9957 ethernet1/2
172.17.99.0/29 172.17.99.1
0 A C ethernet1/2
172.17.99.1/32 0.0.0.0
0 A H
172.17.101.0/24 172.17.99.2
11 A Oo 3285 ethernet1/2
172.31.104.0/29 172.31.104.2
0 A C ethernet1/1
172.31.104.2/32 0.0.0.0
0 A H
172.31.106.0/29 172.31.106.6
0 A C ethernet1/4
172.31.106.6/32 0.0.0.0
0 A H
192.168.1.1/32 0.0.0.0
0 A H
total routes shown: 14
I've simulated an outage on ISP1 WAN link by disconnecting the cable on R1 F0/0 interface (ISP1 Link). There was a short downtime on the
continuous ping from TRUST-USER PC 172.17.101.13.

You can view failover logs under Monitor >
System. Notice there’s a log with a Type of pbf and Event nh-down
(next hop down).

You can also check the Session flows (NAT) under Monitor > Session Browser. Notice the
Egress Interface used on a specific flow was ethernet1/4.

The PBF status went down and the static (floating) route via ISP2 link became active.
admin@PA-200-LAB> show pbf rule all
Rule ID Rule State Action Egress IF/VSYS NextHop
NextHop Status
========== ===== ========== ======== =============== ===========================
============ ==============
LAB-PBF 1 Disabled Forward ethernet1/1 172.31.104.1
DOWN
admin@PA-200-LAB> show routing route
flags: A:active, ?:loose, C:connect, H:host, S:static, ~:internal, R:rip, O:ospf
, B:bgp,
Oi:ospf intra-area, Oo:ospf inter-area, O1:ospf ext-type-1, O2:ospf ext-t
ype-2
VIRTUAL ROUTER: LAB-VR (id 2)
==========
destination nexthop
metric flags age interface next-AS
0.0.0.0/0 172.31.106.1
20 A S ethernet1/4 // THE STATIC ROUTE VIA ISP2 BECAME ACTIVE
172.17.11.0/24 0.0.0.0
10 Oi 10318 ethernet1/3.11
172.17.11.0/24 172.17.11.1
0 A C ethernet1/3.11
172.17.11.1/32 0.0.0.0
0 A H
172.17.99.0/29 0.0.0.0
10 Oi 10318 ethernet1/2
172.17.99.0/29 172.17.99.1
0 A C ethernet1/2
172.17.99.1/32 0.0.0.0
0 A H
172.17.101.0/24 172.17.99.2
11 A Oo 3646 ethernet1/2
172.31.106.0/29 172.31.106.6
0 A C ethernet1/4
172.31.106.6/32 0.0.0.0
0 A H
192.168.1.1/32 0.0.0.0
0 A H
total routes shown: 11
I've put back R1 F0/0 interface and ethernet1/1 went UP and
PBF became Normal again.


No comments:
Post a Comment